Sensor-to-cloud signal pipeline
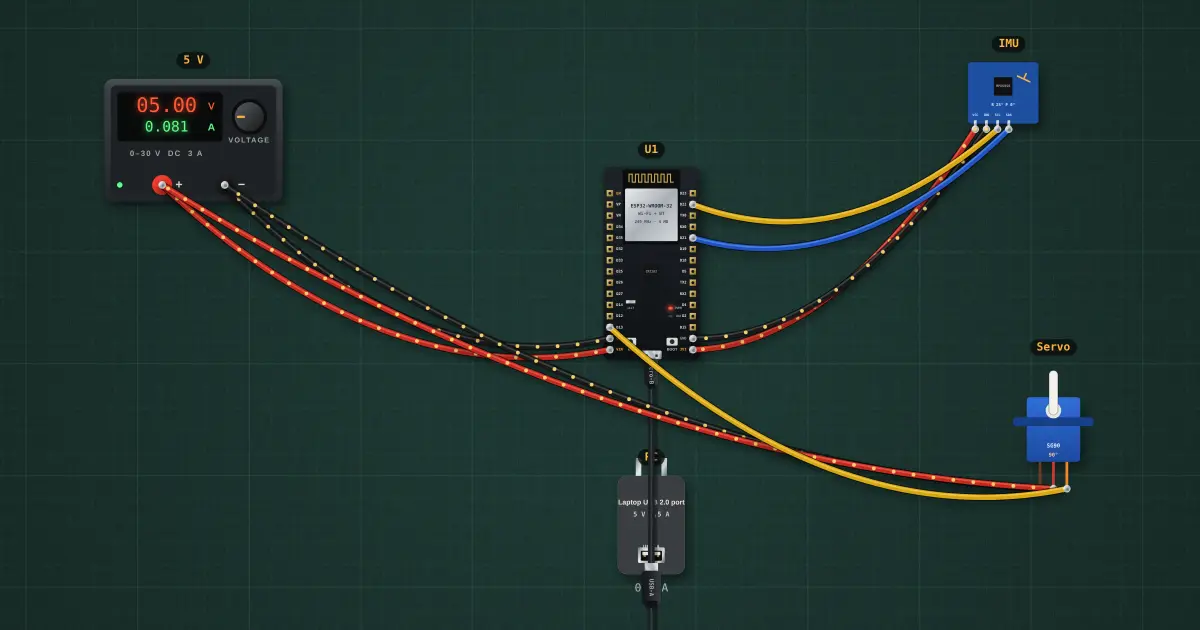
A real device is a chain: a physical quantity becomes a sensor reading, travels a bus as bytes, becomes a number in the microcontroller, drives an actuator, and is reported over the network. Seeing the data at every stage is how you design and debug the whole system, not just one block.
Open this lesson in the labFree, in your browser, no account needed.
How it works
1 · Physical
roll 25°, pitch 0°
the world→2 · Sensor
—
16384 counts = 1 g→3 · I²C bus
—
big-endian bytes→4 · MCU
—
maths and a decision→5 · Actuator
—
PWM, 50 Hz→6 · Network
connecting to Wi-Fi…
every 2 sEach stage changes the representation: an angle becomes counts, bytes, a float, a pulse width, then JSON text. A fault anywhere shows up as the first stage whose value is wrong. Work along the chain to find it.
Latency adds up too: the I²C read, the 100 ms loop delay and the servo’s own slew all sit between a tilt and the horn moving; the network report runs only every 2 s.
Try it on the bench
- Select the IMU and drag the roll slider: follow the number through every stage, from the counts to the bytes, the angle, the pulse width and the JSON payload.
- Pull the SDA wire: stage 2 onwards freezes. That is the stage-by-stage way to localise a fault.
- Edit the sketch to report only when the roll changes by more than 5°: fewer messages, less power, the same information.
Parts on the bench
- Bench power supply
- ESP32 DevKit
- USB charger / port
- MPU-6050 IMU
- Hobby servo
In the course
Zen’s Electronics Design Mastery, module “Capstone — Connected Tracker”.